REAL-TIME
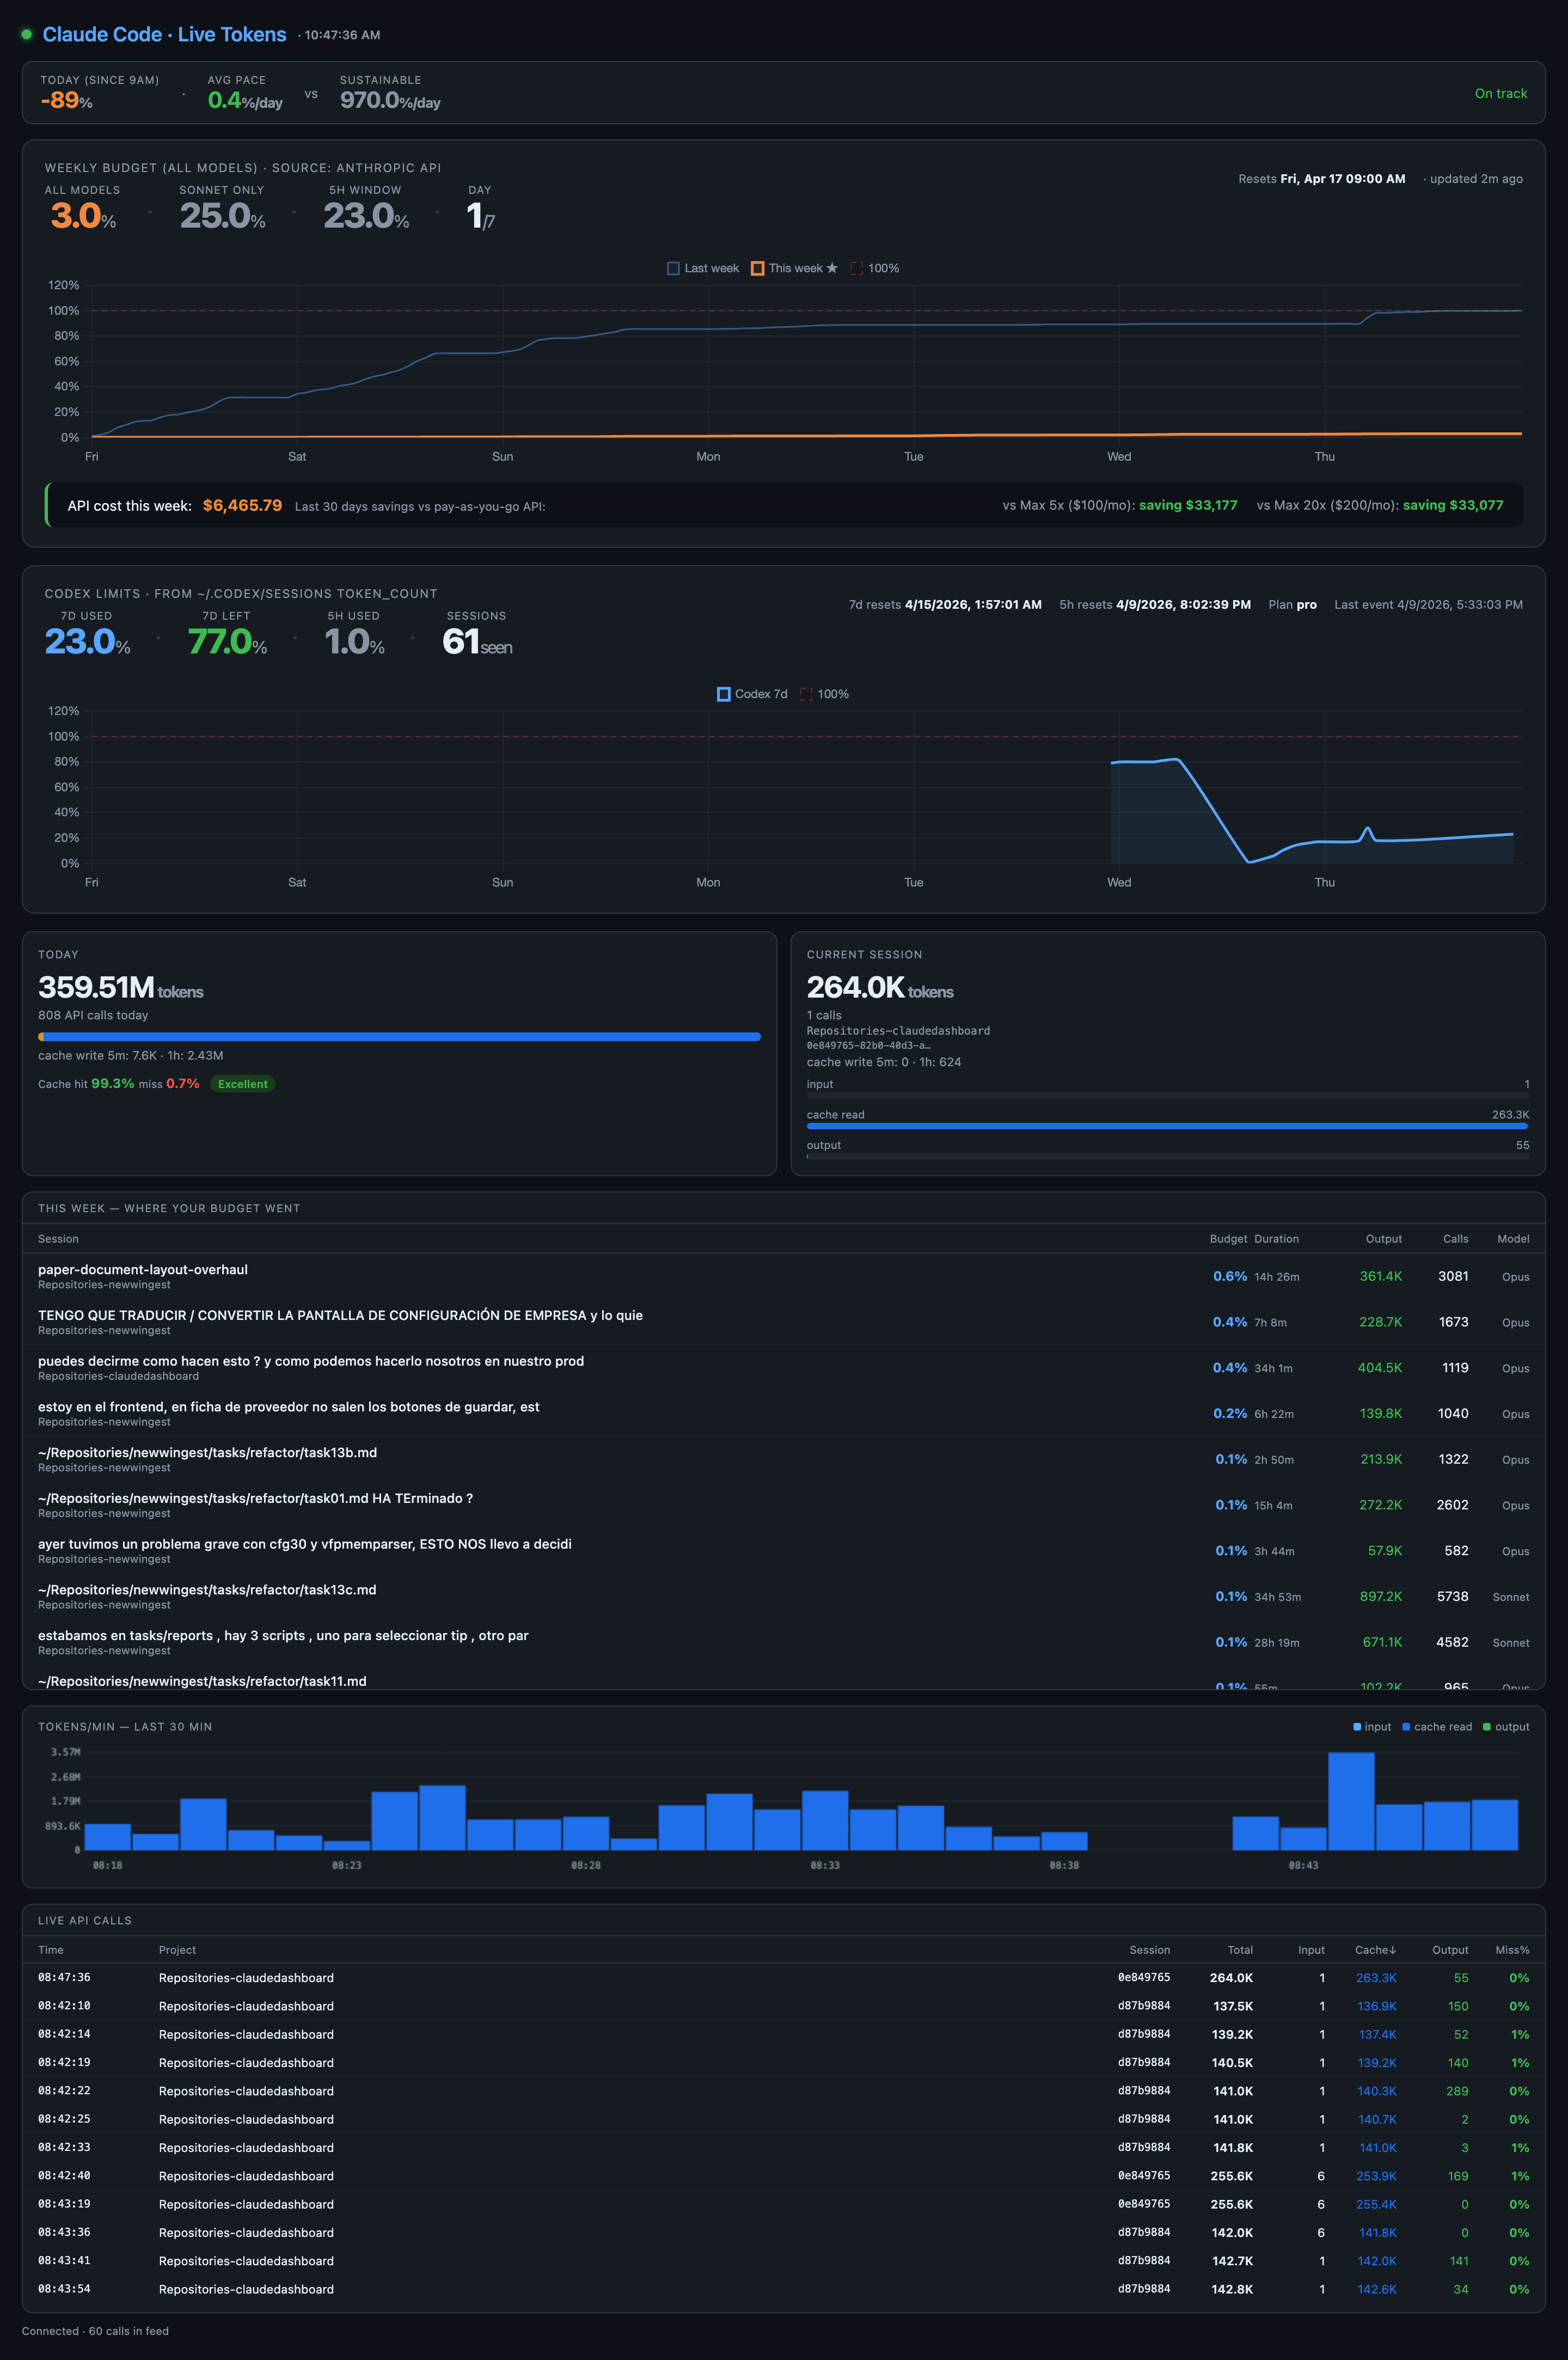
Live SSE dashboard
Watch every AI session as it happens. Tokens, cost, current file, current model — streamed live to your browser via Server-Sent Events.
- › Per-session cost and token burn
- › Current activity table — file by file
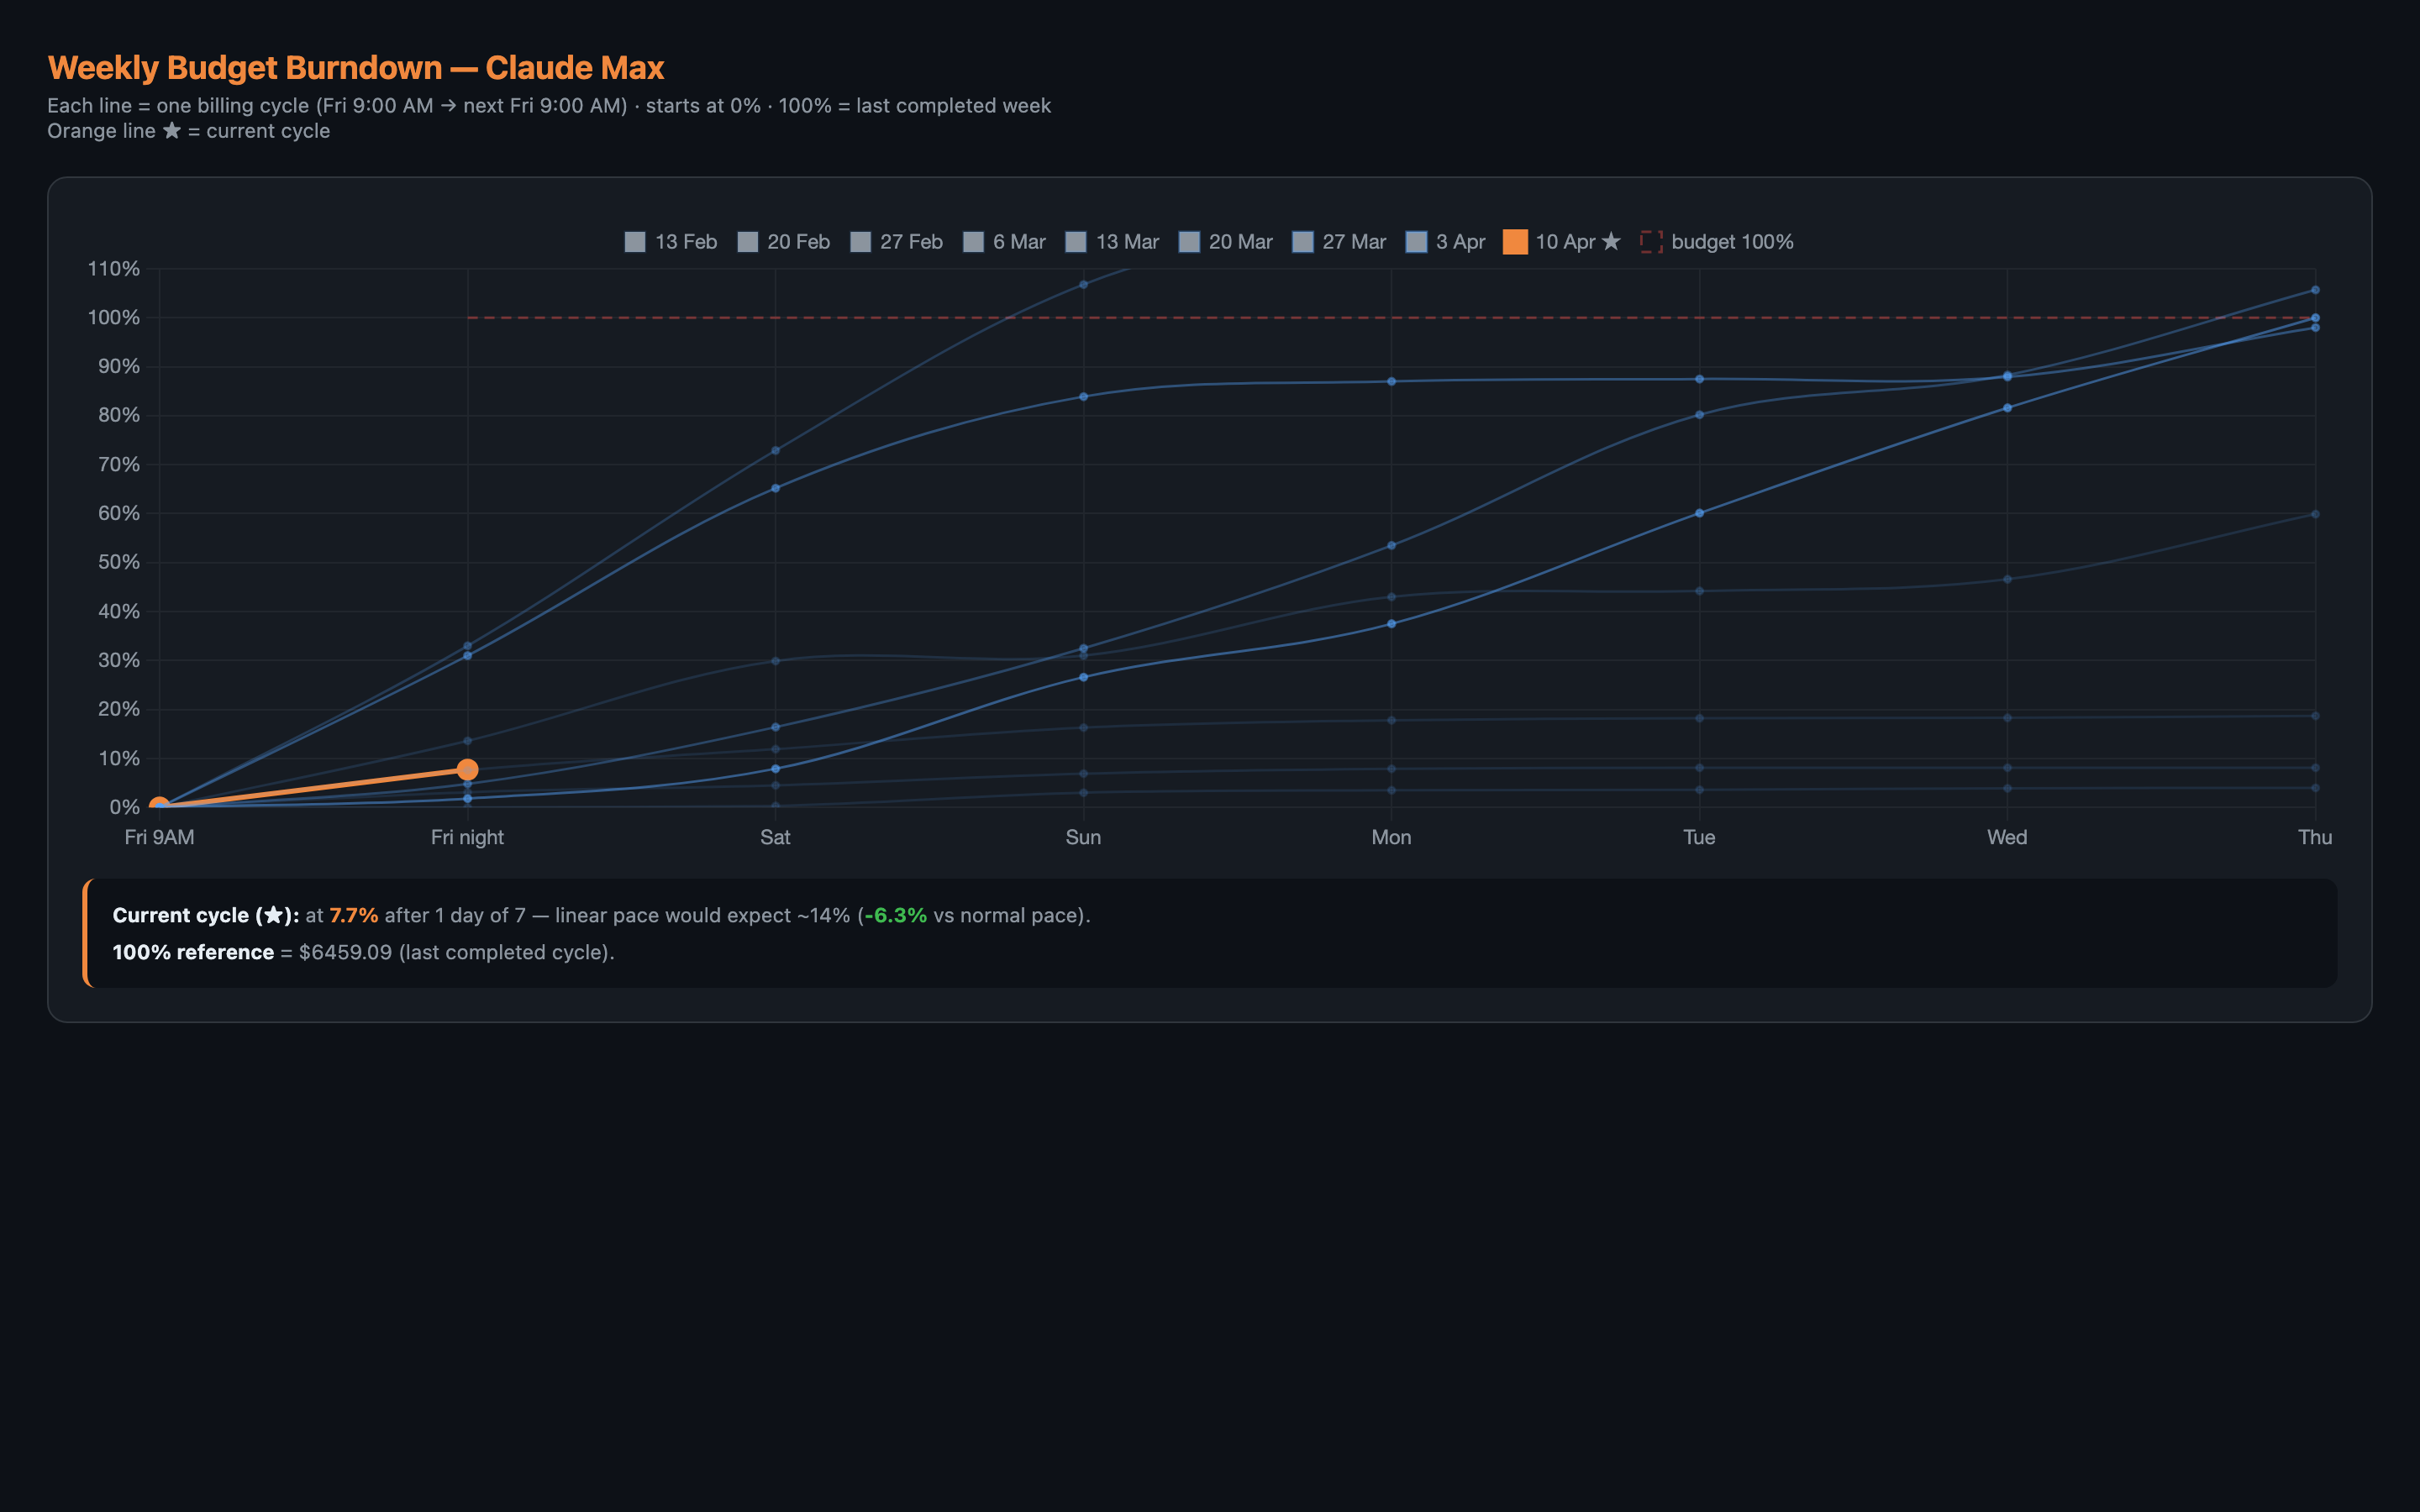
- › Daily / weekly / monthly trend charts
$ iria-monitor live
localhost:8765 — Claude Code Live Tokens